
Plotting Geographic Data with QGIS
We use QGIS to plot a wide range of data types on maps. From basic data over a small area (as small as a field), to data across regions and countries, we can do it. Add rivers, lakes, mountains, contours and elevation. Perhaps you need to examine the distribution of a plant or animal or create a heat map of a variable? Crime in the area, house prices, cockroaches per km - anything is possible. Alternatively, you may want to illustrate a trend over time or produce a map that indicates the risk of a certain phenomenon occurring? Areas at flood risk or erosion, soil type and land use - the possibilities are endless and QGIS allows a a vast range of data types to be plotted.
We can make maps for you or show you how to do it. Check out UK land use data we have mapped here
Get QGIS here - it's free!

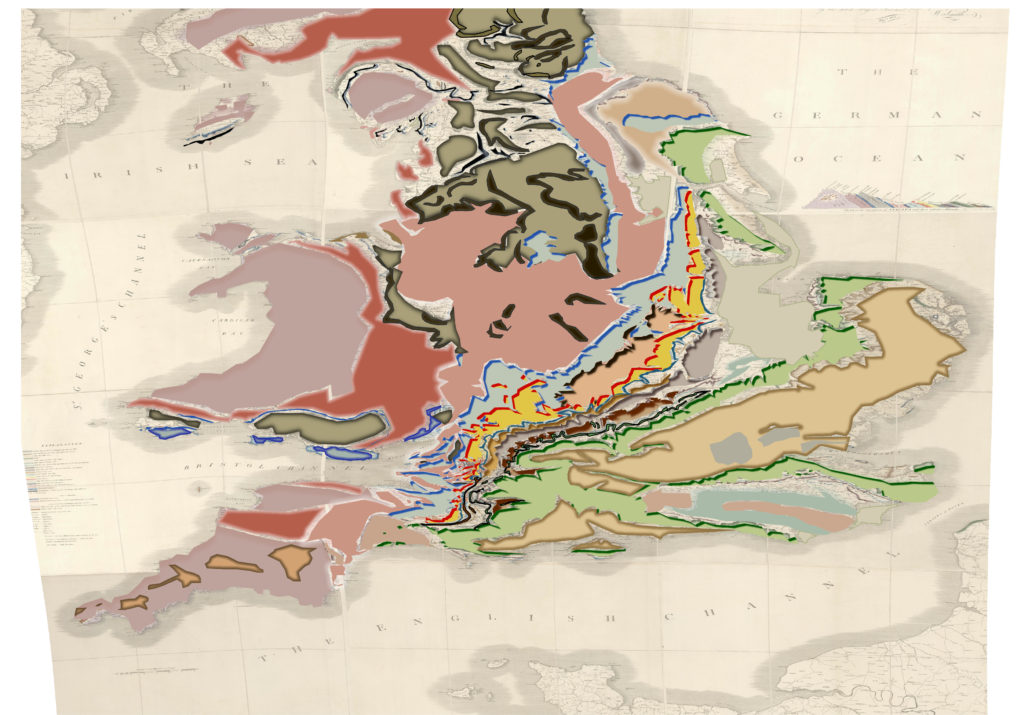
For those of you that are interested, the first map in the slider at the top of the page is a QGIS version of the very first geological map of England and Wales. The electronic version of the map has been overlaid over a georeferenced image (that is why it is warped) of the manificent map produced by William Smith in 1815. More information on this map can be found at the Royal Geological Society website.
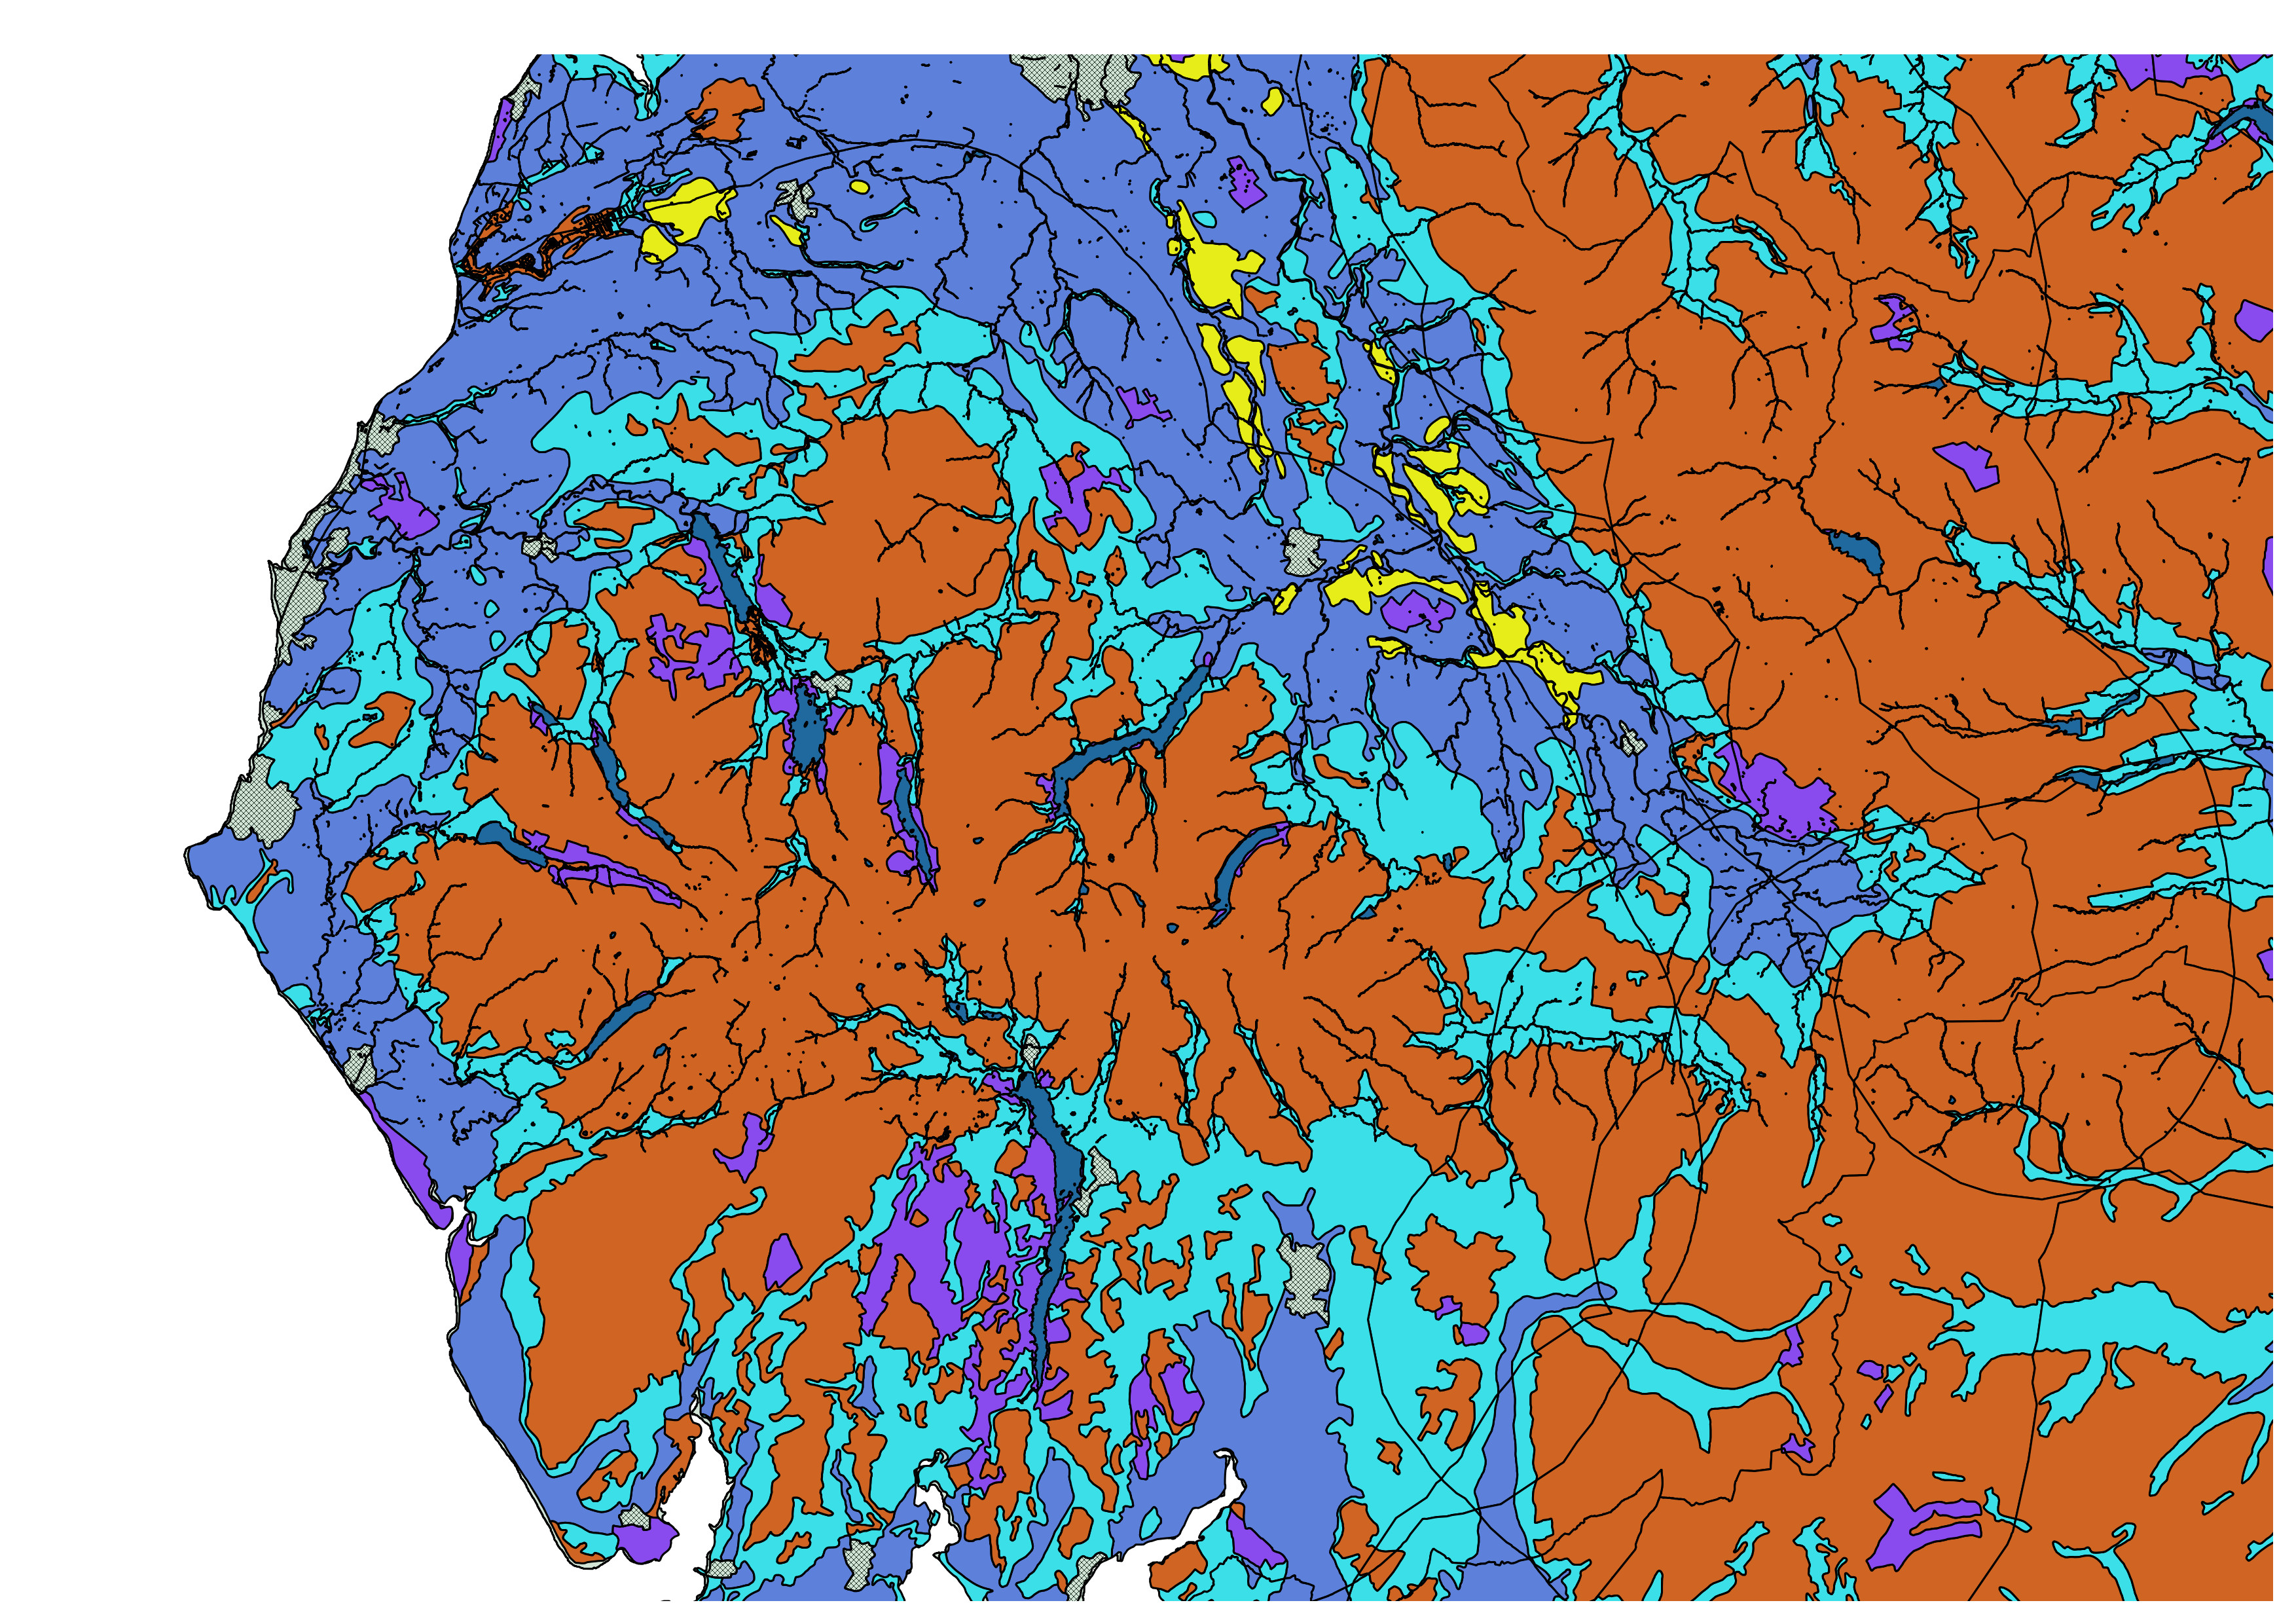
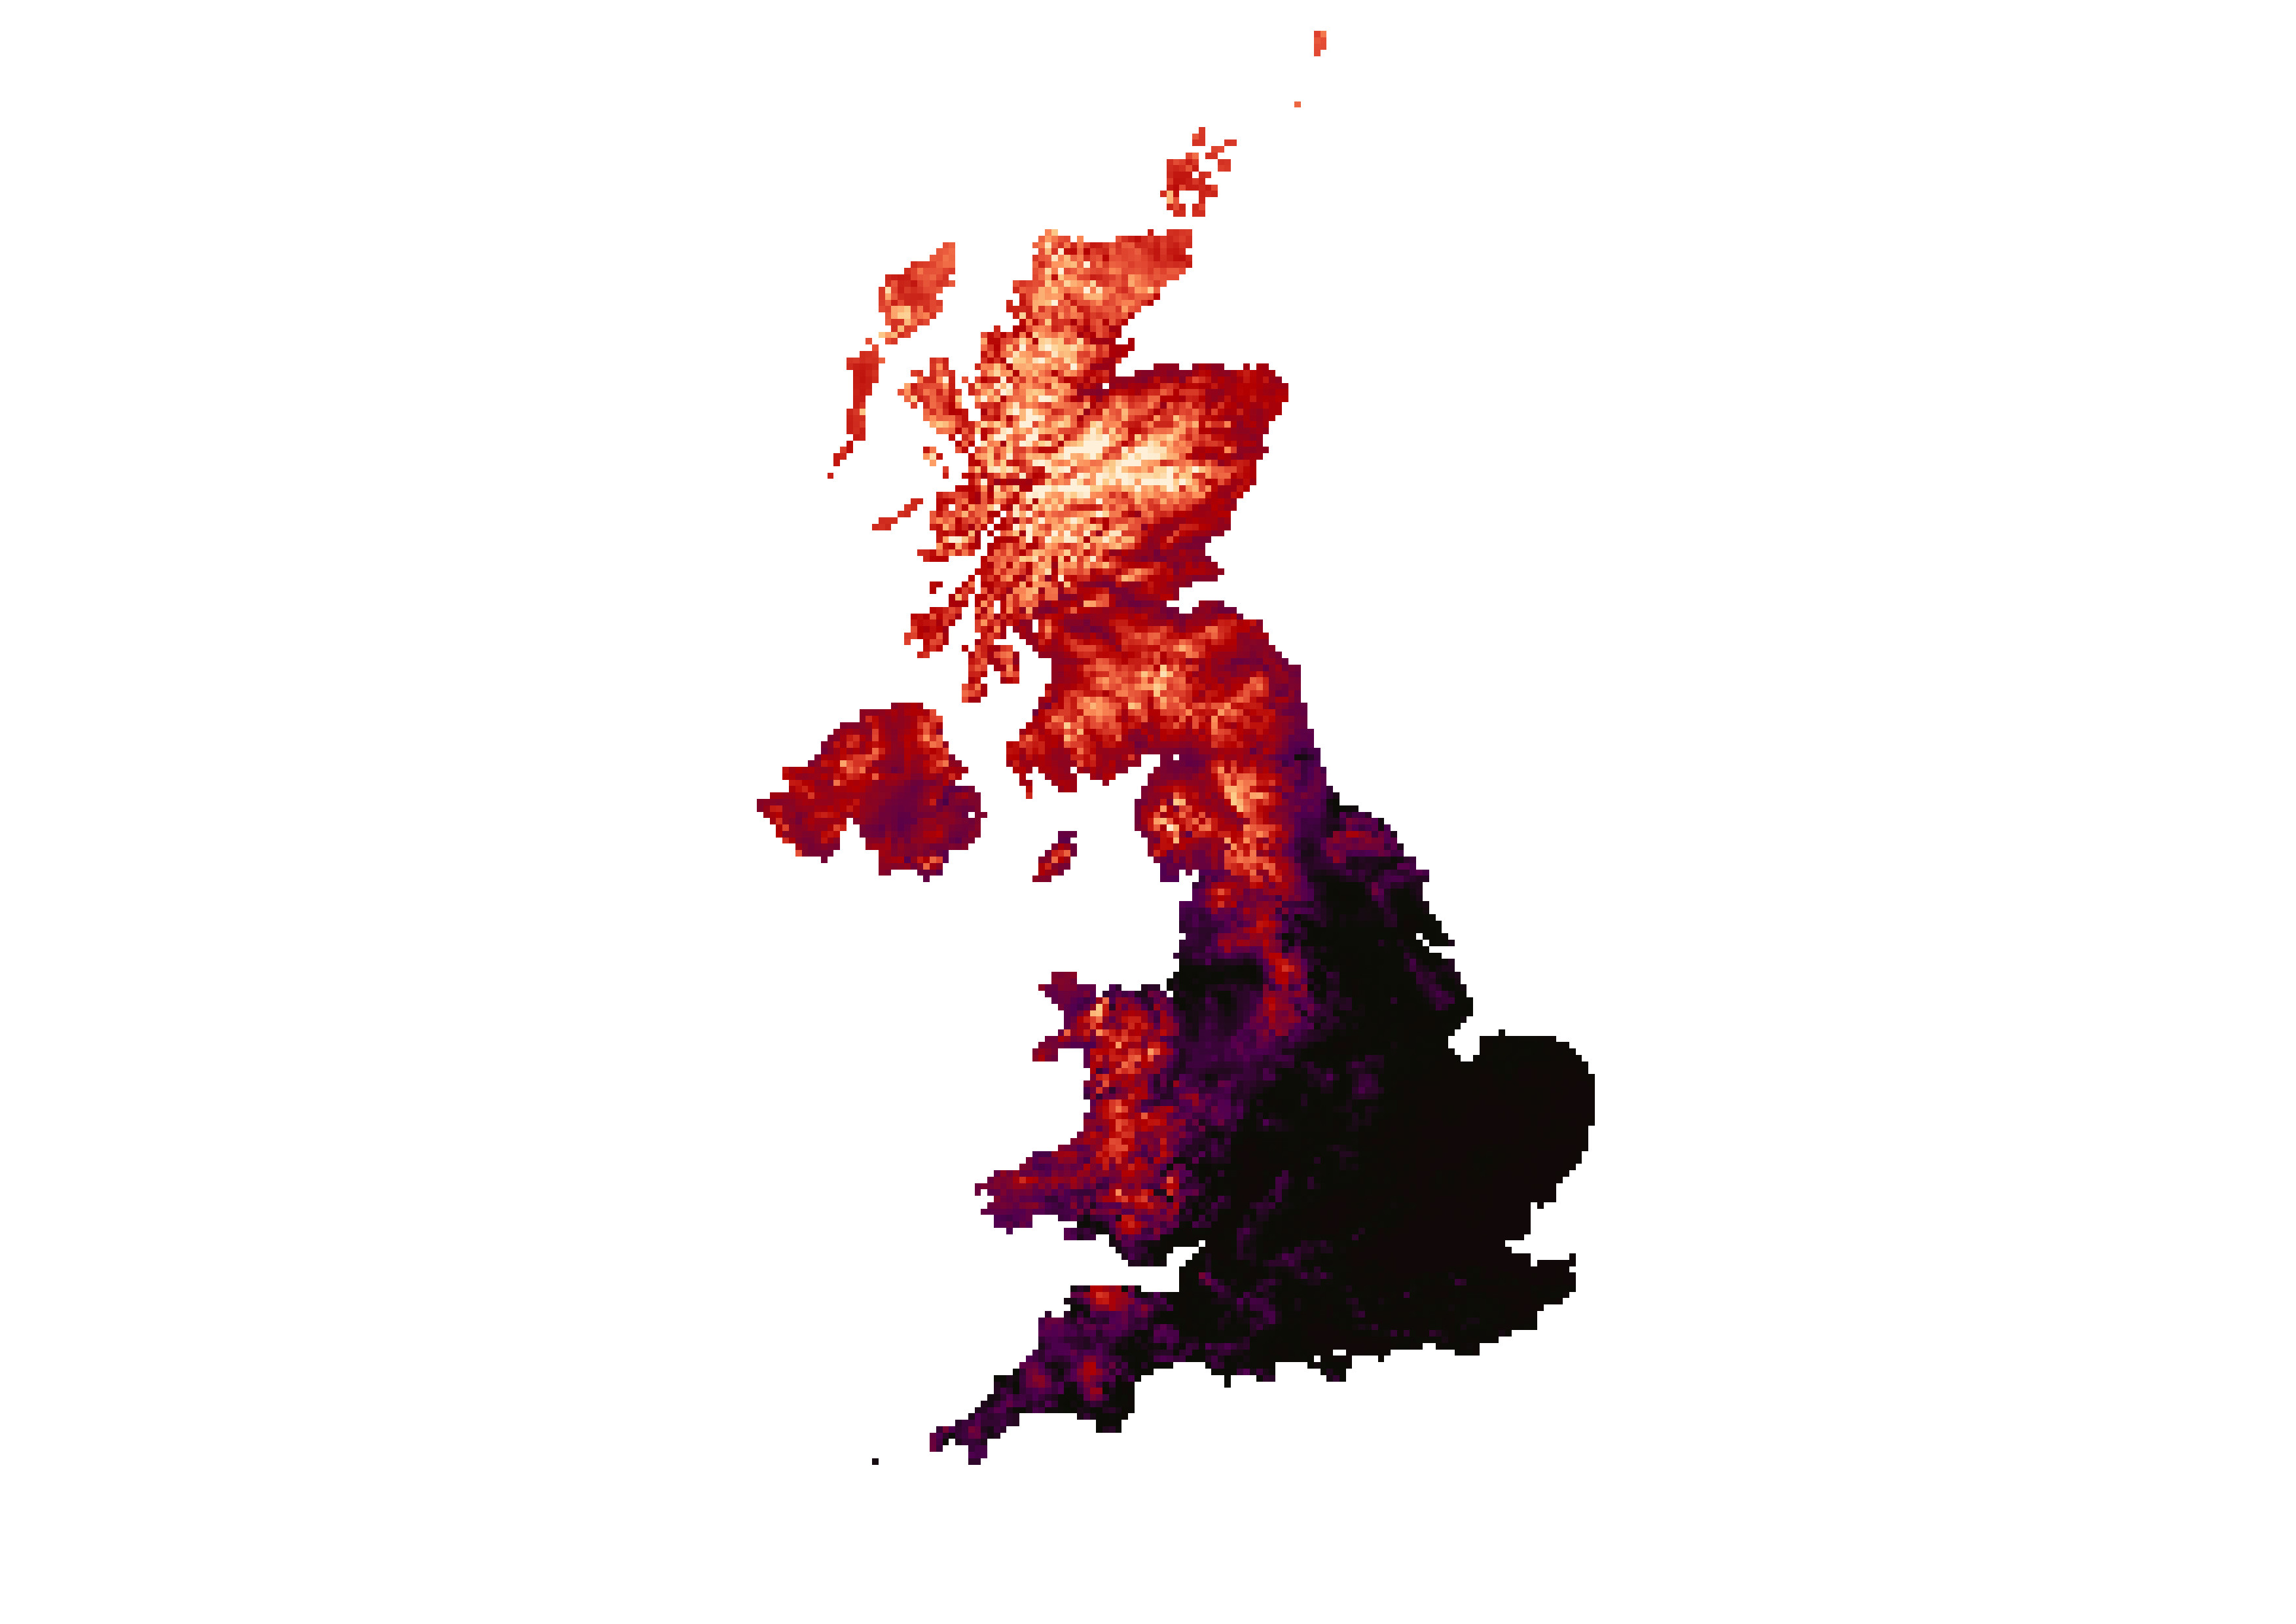
The video below is an incremental building of the UK/Cumbria of the bedrock geology, elevation, contours, land classification, lakes and rivers, and ancient woodland